
Prometheus Metrics
Aralez built-in Prometheus metrics reference
Prometheus metrics are exposed at http://config_address/metrics — by default http://127.0.0.1:3000/metrics.
Example Grafana Dashboard
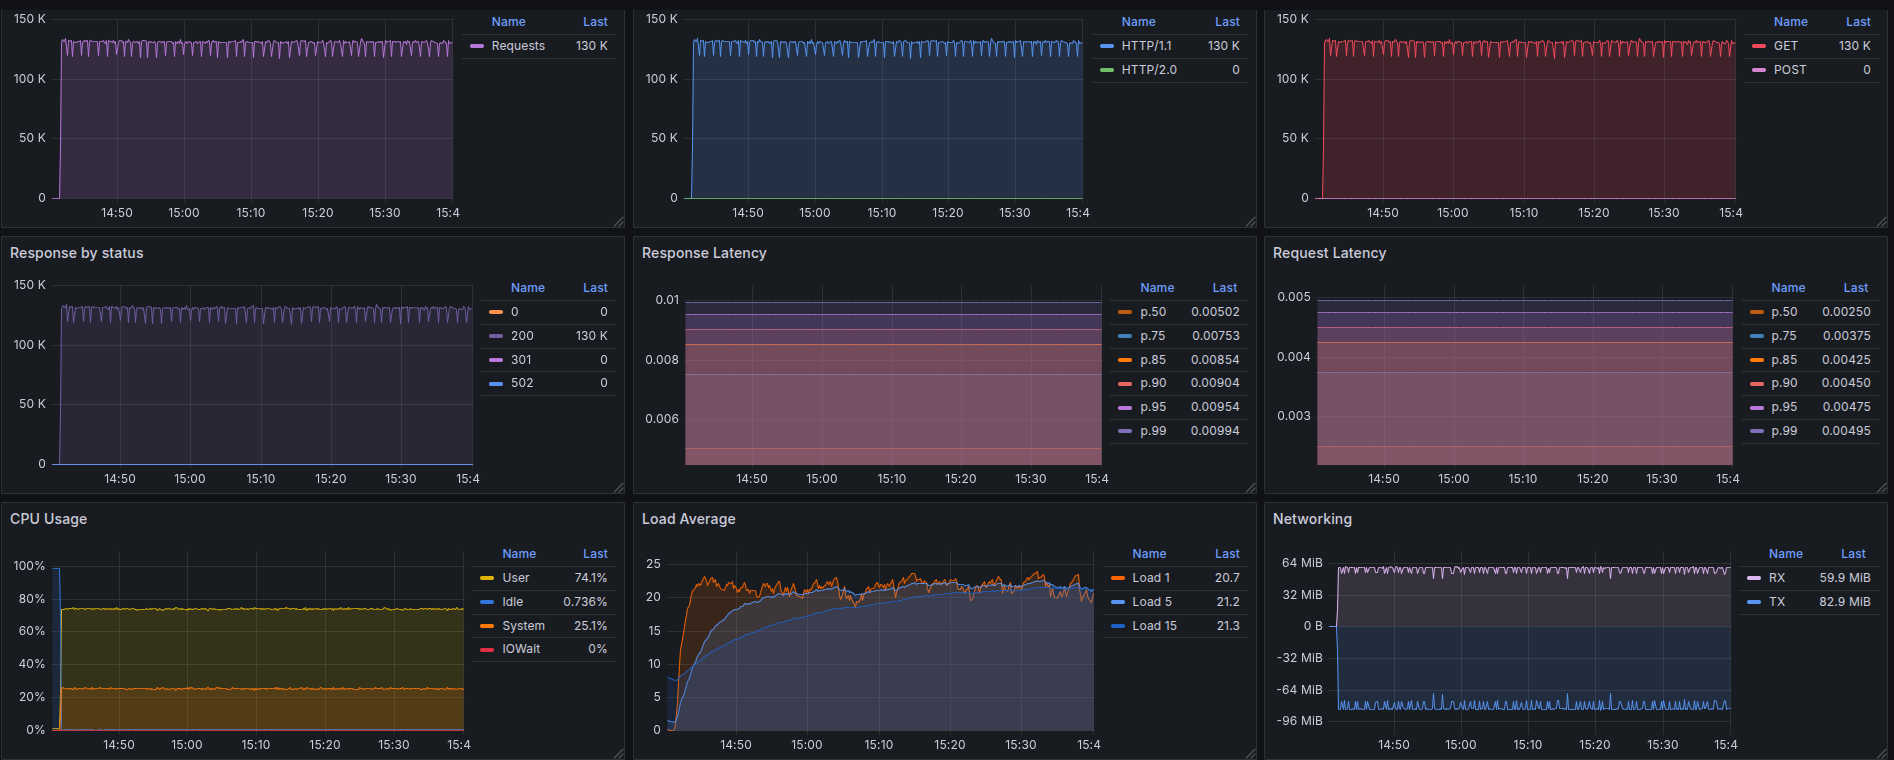
Metric Summary Table
| Metric Name | Type | Unit | Description |
|---|---|---|---|
aralez_active_sessions | Gauge | Count | Current number of active user/client sessions. |
aralez_cache_evicted_bytes_total | Gauge | Bytes | Total memory size of data evicted from the cache. |
aralez_cache_evicted_items_total | Gauge | Count | Total number of individual items evicted from the cache. |
aralez_cache_items | Gauge | Count | Current total number of items stored in the cache. |
aralez_cache_size_bytes | Gauge | Bytes | Current memory consumption of the cache in bytes. |
aralez_logging_errors | Gauge / Counter | Count | Total count of logging error events recorded. |
aralez_memory_bytes | Gauge | Bytes | Total memory currently allocated by the process in bytes. |
aralez_open_files | Gauge | Count | Number of open file descriptors currently held by the application. |
aralez_requests_by_method_total | Counter | Count | Total HTTP requests processed, partitioned by HTTP method. |
aralez_requests_by_upstream | Counter | Count | Total HTTP requests routed, partitioned by targeted upstream server. |
aralez_requests_by_version_total | Counter | Count | Total HTTP requests received, partitioned by HTTP protocol version. |
aralez_requests_total | Counter | Count | Aggregate count of all HTTP requests handled by Aralez. |
aralez_response_latency_seconds | Histogram | Seconds | Distribution of HTTP response latency in seconds. |
aralez_responses_total | Counter | Count | Total HTTP responses returned, partitioned by HTTP status code. |
Detailed Metric Breakdown
1. Request & Response Metrics
aralez_requests_total
- Type: Counter
- Description: Tracks the cumulative number of HTTP requests processed by the Aralez application since process start.
- Usage: Calculate overall throughput using PromQL:
rate(aralez_requests_total[5m]).
aralez_requests_by_method_total
- Type: Counter
- Labels:
method: The HTTP request method (e.g.,GET,POST,PUT,HEAD).
- Description: Tracks request traffic broken down by HTTP protocol verb.
aralez_requests_by_version_total
- Type: Counter
- Labels:
version: The HTTP protocol version used (e.g.,HTTP/1.1,HTTP/2.0).
- Description: Breakdown of request volume by protocol version.
aralez_requests_by_upstream
- Type: Counter
- Labels:
upstream: Hostname or IP of the destination upstream server (e.g.,localhost,apt.netangels.net).
- Description: Tracks traffic distribution across upstream backend dependencies.
aralez_responses_total
- Type: Counter
- Labels:
status: HTTP response status code (e.g.,200,502).
- Description: Total responses generated, grouped by HTTP response code.
- Usage: Useful for calculating error rates (e.g., ratio of
5xxresponses to total responses).
aralez_response_latency_seconds
- Type: Histogram
- Associated Metrics:
aralez_response_latency_seconds_bucket{le="..."}: Count of requests completed within the specified latency threshold (le= less than or equal to seconds).aralez_response_latency_seconds_sum: Cumulative total of all response latencies in seconds.aralez_response_latency_seconds_count: Total number of measured requests (matchesaralez_requests_total).
- Description: Measures request execution duration to calculate percentiles (p50, p95, p99).
- Usage: Calculate 95th percentile latency over 5 minutes:
histogram_quantile(0.95, sum(rate(aralez_response_latency_seconds_bucket[5m])) by (le))
2. Cache Metrics
aralez_cache_items
- Type: Gauge
- Description: Instantaneous measurement of the number of items currently held in memory cache.
aralez_cache_size_bytes
- Type: Gauge
- Description: Current memory consumption of the active cache in bytes.
aralez_cache_evicted_items_total
- Type: Gauge (Behaves as Counter)
- Description: Cumulative number of objects removed from the cache due to memory limits or eviction policies.
aralez_cache_evicted_bytes_total
- Type: Gauge (Behaves as Counter)
- Description: Cumulative size (in bytes) of all objects evicted from the cache.
3. System & Session Metrics
aralez_active_sessions
- Type: Gauge
- Description: Real-time count of currently connected or active client sessions.
aralez_memory_bytes
- Type: Gauge
- Description: Current memory allocated by the application process (in bytes).
aralez_open_files
- Type: Gauge
- Description: Number of open file handles currently used by the process. Monitor to prevent hitting operating system file descriptor limits (
ulimit).
aralez_logging_errors
- Type: Gauge
- Description: Count of error events logged by the application system.